Build Your First Google Ads Dashboard in Claude (No Code Needed)
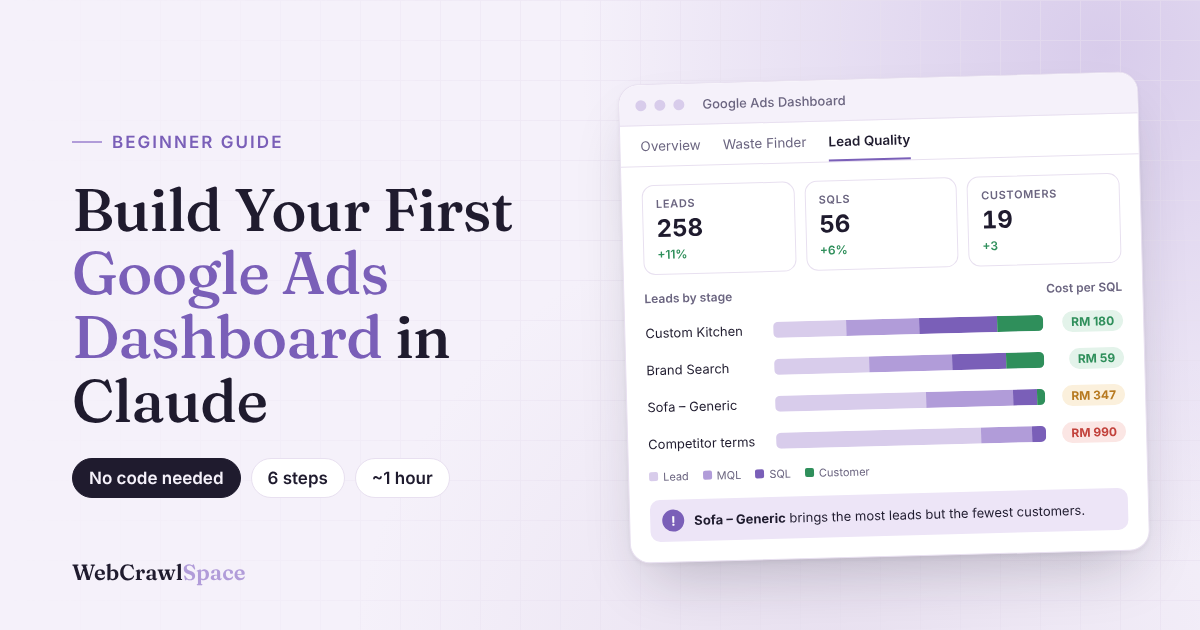
Turn three spreadsheet downloads into a dashboard that shows which ad spend brings in real customers, not just form fills. Six steps, about an hour, no BigQuery.
This guide is for marketers who run Google Ads for leads and have never built anything with Claude. If you’re still mapping out how ads, landing pages and follow-ups fit together, start with our full-funnel marketing strategy guide.
Before you start, have these ready
- You need a paid Claude account to create projects and upload files, check your account plans through Anthropic’s help center.
- Access to your Google Ads account.
- Your leads from a CRM tool such as HubSpot or Zoho, or a Google Sheet.
Why Google Ads reports aren’t enough
Google Ads tells you how many people filled in your form. It can’t tell you whether those people were a good fit or ever paid you. That part lives in your CRM.
Words you’ll see
| Word | DESCRIPTIONS |
|---|---|
| CRM | Where you keep your leads and customers (HubSpot, Zoho, or a spreadsheet) |
| MQL | A lead that looks like a good fit |
| SQL | A lead your sales team agreed to follow up |
| Artifact | An interactive page Claude builds for you in the chat |
| Project | A Claude workspace that remembers your files and instructions |
Step 1: Pick one question
5 minutes · No tools needed for this step
Most dashboards fail because they try to answer everything at once, and you end up with a wall of charts you never act on. So before you download anything, decide on the one question you most want answered, since that question will shape every file you pull in Step 2.
If you’re stuck, start with the one most marketers care about: which campaigns bring in leads that actually turn into customers?
| Examples of Questions | Download these |
|---|---|
| Which campaigns bring good leads? Start here | Campaign report + lead list |
| Where am I wasting money? | Search terms report + lead list |
| Am I doing better than last month? | Campaign report covering two months |
| Which keywords bring leads that never buy? | Keyword report + lead list with stages |
Done when: Your question is written in a note. You’ll paste it into Claude in Step 4.
Step 2: Download your data
15 minutes · Google Ads + your CRM
You only need three files to get started:
- Your Google Ads keyword report
- Search terms report and
- Lead list
The one rule that matters is to pull all three for the same date range, such as the last 60 days, because if the dates don’t match, Claude ends up comparing spend from one period against leads from another and the numbers stop making sense.
File 1 and 2: Google Ads keywords and search terms
- In Google Ads, open Keywords.
- Set the date range in the top right.
- Check that Cost, Clicks, Impressions and Conversions columns are showing.
- Click the Download icon and choose .csv.
- Open Search terms and repeat steps 2 to 4.
| Keyword | Campaign | Cost | Clicks | Impr. | Conv. |
|---|---|---|---|---|---|
| custom sofa kl | Sofa – Generic | RM 1,820 | 812 | 14,320 | 46 |
| built in kitchen cabinet | Custom Kitchen | RM 1,410 | 466 | 6,980 | 19 |
| rumah kemas | Brand Search | RM 640 | 512 | 1,940 | 34 |
File 3: Your lead list
Export from your CRM, or copy from your Google Sheet. Keep the green columns. Delete the red ones.
| Name | Phone | Date created | Stage | Campaign / UTM | Lost reason | Deal (RM) | |
|---|---|---|---|---|---|---|---|
| A. Tan | a.tan@… | 012-… | 02/10/2026 | SQL | custom_kitchen | 8,400 | |
| R. Kumar | r.k@… | 017-… | 04/10/2026 | Lead | sofa_generic | Budget too low | |
| N. Aziz | nur@… | 019-… | 05/10/2026 | Customer | brand_search | 3,200 |
No keyword in your lead list? That’s common. Claude can still match leads by campaign name or landing page. Adding UTM tags to your ad links will make next month’s report sharper.
Done when: you have three CSV files, same date range, no personal details.
Step 3: Set up a Claude Project
10 minutes · Time to work on Claude
One thing Claude lacks out of the box is context about your business, because every new chat starts with a blank slate. A Project fixes that by keeping your files and instructions in one place, so Claude already knows your currency, your lead stages and what counts as a good lead the moment you open a new chat.
- In Claude, create a new Project called “Google Ads Dashboard”.
- Upload your three files to the Project’s files.
- Paste the instructions below into the Project’s instructions, then edit the brackets.
Files
Instructions
You are my PPC analyst. I run Google Ads to get leads for [your business].
Currency: RM.
Our lead stages, in order: Lead > MQL > SQL > Customer.
A "good lead" is one that reaches SQL or Customer.
If something in the data is unclear or missing, ask me instead of guessing.
The last line matters most. It tells Claude to flag gaps instead of filling them in, which keeps your numbers honest.
Done when: your Project shows three files and your edited instructions.
Step 4: Ask Claude to build your Google Ads dashboard
10 minutes · Get it done with a single prompt
Open a new chat inside your Project and paste this prompt. Swap in your question from Step 1 if it’s different.
Using the files in this project, build me an interactive Google Ads dashboard.

My main question: Which campaigns bring in leads that turn into customers?

Create 3 tabs:
1. Overview: spend, clicks, conversions and cost per conversion by campaign,
   compared with the previous period.
2. Waste Finder: search terms and keywords that spent money but brought
   no leads, or only leads that never reached SQL. Sort by money wasted.
3. Lead Quality: match my leads to campaigns. Show how many reached each
   stage (Lead, MQL, SQL, Customer) and the cost per SQL.

Use simple tables and bar charts. Add a date filter.
At the top of each tab, show the date range and anything you couldn't match.
The first version won’t be perfect. That’s normal. Click through every tab, note what looks off, and fix it in Step 5.
Done when: you can open the dashboard and click through all three tabs.
Step 5: Make it tell you what to do
15 minutes · Follow-up prompts
Right now your dashboard tells you what happened, which is useful, but the real value comes when it starts telling you what to change. The trick is to ask Claude for one improvement at a time, so you can check that each change makes sense before you build on it.
| Search term | Cost | Conv. |
|---|---|---|
| sofa murah bawah rm100 | RM 412 | 9 |
| ikea sofa | RM 318 | 6 |
| used sofa for sale | RM 290 | 0 |
| Search term | Cost | Verdict |
|---|---|---|
| sofa murah bawah rm100 | RM 412 | 0 SQL |
| ikea sofa | RM 318 | 0 SQL |
| used sofa for sale | RM 290 | No leads |
| What you want | Paste this | |
|---|---|---|
| A to-do list | Add a Next Steps box at the top that lists the 5 biggest problems, ranked by money at stake. | |
| Your own idea of waste | Only count a search term as waste if it spent more than RM50 and brought no SQLs. | |
| Fair comparisons | Compare every number with the previous period and show the change as a percentage. | |
| Fewer mystery leads | List the leads you couldn’t match to a campaign, so I can check them. | |
| Simpler charts | Remove anything I can’t act on. Keep only charts that help me decide where to spend. |
Before you add any chart, ask yourself what you’d change because of it. If the answer is nothing, leave it out.
Want a second opinion on the landing pages your ads send people to? Our free site audit series shows what we check on real Malaysian brands.
Done when: your dashboard has a Next Steps box that names at least one change to make.
Step 6: Check the numbers before you trust them
10 minutes · Google Ads + Claude
AI can misread a column or skip a row. Tick each check below before you move any budget.
Add a note at the top of each tab showing the date range, any missing dates, and how many leads were unmatched.
Done when: all five boxes are ticked. Now you can act on what the dashboard says.
The whole guide on one screen
When you’re ready to level up
Working from CSV files is the easiest way to start, but it does mean downloading fresh exports every time you want updated numbers. Once that starts to feel like a chore, these options let Claude pull the data in for you:
| Option | What it gives you | Effort |
|---|---|---|
| CRM connector | Claude reads your leads directly (HubSpot, Zoho and others) | Low |
| Google Ads API via Google’s MCP server | Live Google Ads data, no exports | Medium |
| BigQuery | A daily copy of your ad data that you keep long term | High |
For a deeper, technical build using all three, read Search Engine Land’s guide to building a Google Ads dashboard with Claude.
Start small
You don’t need the perfect dashboard on day one. Start with one question, three files and a single prompt, and once you trust what the numbers are telling you, come back and add the next question.
Wrapping Up
Google Ads will always tell you how many people filled in your form, but it was never built to tell you who actually became a customer. That’s the gap this dashboard closes, and with Claude, closing it takes an afternoon and three spreadsheet downloads instead of a developer and a data warehouse.
Once you’ve built it, you’ll probably find yourself opening it before every budget meeting, because it’s hard to go back to judging campaigns on form fills once you’ve seen which ones actually bring in paying customers. Keep it simple at first, and add new questions as they come up.
If your ads are sending people to landing pages that don’t convert, even the best dashboard can only show you the problem. That’s where a proper look at the page itself helps, and it’s exactly what we do in our free site audits.
FAQs
Do I need to know how to code?
No. You describe what you want in plain English, and Claude builds it.
Is it safe to upload my Google Ads data?
Remove names, emails and phone numbers first. Campaign and spend data is usually fine, but follow your company’s data policy.
Will the dashboard update by itself?
Not with CSV files. Upload new exports and ask Claude to refresh it. A connector can make this automatic.
Why don’t my numbers match Google Analytics?
Google Ads and GA4 count conversions differently, so small gaps are normal. Pick one source and stick with it.
Can I add Meta or Microsoft Ads later?
Yes. Upload their exports to the same Project and ask Claude to add a tab for each.
Demo figures are fictional. Screens are illustrations; Claude and Google Ads layouts change over time. Last checked 1 Nov 2026.